You just finished your first month running PPC ads for a client and you wake up to an email like this:
“Hey Marketing Guy,
I’d like to get an update on the status of our ads – pronto.
How much $$$ are we making?”
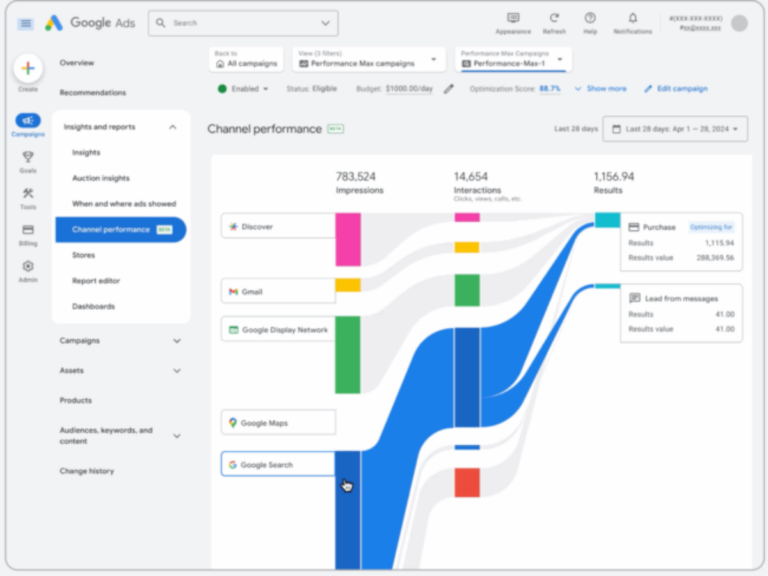
So you log into Google Ads, click over to the campaign view and snap a screenshot. You immediately draft an email, attach the screenshot and hit send.
If only it was ever that simple.
The Problem
You send the screenshot, but that’s just the beginning. Next they want to know how Google Ads is performing relative to Meta Ads, next to an aggregated view combining both datasets, for the whole year.
Fair enough…
Then they request that you throw in some year over year comparisons so they can see if they are up or down.
And finally… they ask you to update the dashboard every day so they can have the freshest data.
Now you’re starting every morning neck-deep in spreadsheets, custom formulas, and endless copy-pasting.
Slowly your spreadsheets start having issues, requests to customize the dashboards keep piling up, and before you know it you are committed to a system that can’t scale with your clients’ needs and causes more questions than answers.
Reporting in Digital Marketing is A Complex Beast
For years, I was that person at Digital Position—the “reporting guy”—chained to spreadsheets, wrestling with conversion tracking, and endlessly tweaking performance dashboards for clients.
As Digital Position grew, our reporting challenges grew too. What worked for 20 clients became chaotic for 50. It was clear we needed something more efficient and scalable.
This realization eventually led us to eventually create our own free reporting solution: DataPulse.
But we didn’t start there…
Our Reporting Journey: From Google Sheets to DataPulse
Initially we went the route of templated dashboards in Google Sheets. We used a 3rd party data pulling tool called Supermetrics to pull data broken out by date. Then we manipulated the data to show metrics grouped by month with year over year comparisons.
This was pretty effective – Supermetrics lets you schedule daily data pulls so whenever we checked the dashboards they would be fresh. Breaking out the metrics the way we did gave us the answers to most of the performance related questions that clients threw at us, plus we could share the dashboards with them so everyone was tracking the data in real time.
Then we leveled up and started feeding the data into Looker Studio (formerly Google Data Studio). That gave us the opportunity to introduce well designed dashboards that aligned with our brand and drew attention to specific KPIs.
Everything was templated, so as soon as we signed a new client, we would build out their dashboards in a matter of minutes, set up the queries and then boom – fully automated performance dashboards.
But then – ultimate betrayal. Supermetrics – the very wave we rode to greatness became the iceberg that plunged us into darkness. All of a sudden, they released these new pricing plans that were designed to squeeze as much profit as possible out of agencies.
Supermetrics Demanded a Price We Couldn’t Pay
Supermetrics had always been expensive, even back in the day. But for the price you got 99% consistent accuracy and full automation which just didn’t exist anywhere else.
But when they switched to the new pricing plans, they restricted the number of data sources that each tier could access.
For example, The Core plan for $159 / month only lets you access 14 data sources (out of 150).
So you wouldn’t be able to access over 90% of the platforms unless you move up to the Enterprise plan (which conveniently doesn’t have a price listed on the website).
If you’re on the Core plan for example and want to integrate Amazon Ads data into a client’s reporting, you will need to upgrade your whole account to an Enterprise plan or else pay $30 more per month per data source. They limit you to 5 “add-ons”, so everything is geared towards getting their users onto a custom Enterprise plan where they can charge exorbitant prices for the same level of service.
Supermetrics isn’t alone here, several other tools have come to the fore like PowerMyAnalytics for example, and it is using the exact same strategy of restricting specific data sources behind higher priced plans.
We really tried to make it work with these data connectors, we’d built our whole system around them. But the costs continued to rise and it became impossible for us to justify them as a small agency.
We were NOT going back to downloading CSVs and manually copy pasting data.
So what other options did we have?
There was only one way we could solve our reporting problems once and for all and achieve all of our goals.
We had to build a tool from scratch.
Why We Built DataPulse: Simplifying Reporting for Agencies and Businesses
The existing tools on the market were powerful, but everything came with limitations:
- Google Sheets
- Requires 3rd party integrations to update
- Can’t control the design
- Looker Studio
- Terrible UI
- Slow
- Need 3rd party integrations to update
- Supermetrics
- Expensive
- Queries often fail for some platforms like Shopify
- PowerMyAnalytics
- Cheaper than Supermetrics – but had accuracy issues for some platforms
We needed a system that could pull data automatically from EVERY platform our clients used, and somehow turn that into insightful, pleasing to look at reports that were accessible by our employees and clients alike.
With this in mind, we began development on what would become one of the most intensely grueling, yet insanely awesome projects of my career as a reporting guy / web developer.
Was It Worth It?
It’s been 5 years since then, and oh boy what a journey.
You’re probably wondering if we ended up saving money by bringing this in-house instead of continuing to fork over money to Supermetrics.
The short answer is no.
The long answer is noooooooooooo…
To give a more nuanced answer, the cost of development is only one factor in determining the value of this project.
So what return did we get on our investment?
- A deep understanding of how to measure cross-channel performance and how data drives marketing strategy
- True freedom with data. We can build any visualization, graph, or table that we can dream of
- Not dependent on a 3rd party data pulling tool with all its quirks, bugs and costs
- Can combine data sources with ease
- Optimized workflow – daily performance checks are a breeze with DataPulse
- Full client transparency – both teams looking at the same data
It’s hard to quantify these things monetarily, but at the end of the day, the result of our hard work was a tool that transformed the way we see marketing & will provide ongoing value for years to come.
And now we’re offering it to the world for free so you can reap these benefits too.
How Does DataPulse Work?
Here’s how it works in a nutshell:
DataPulse is a web application that lets users add accounts. Each account gets configured and account IDs must be input.
Every morning, DataPulse loops through each account and automatically pulls data from the various marketing platform APIs on behalf of the user. (This is the same way that Supermetrics pulls data).
The data is stored in our database, broken up by date.
When a user logs in and visits a dashboard, DataPulse will combine the raw data and calculate final numbers for display to the user.
DataPulse replaces Google Sheets, Supermetrics & Looker Studio with a single tool.
It might sound complex, but it’s really quite simple.
If you want to see for yourself, all you have to do is sign up for free, add a business account, authenticate, and pull data into your beautiful new dashboards
The Future of Digital Marketing Reporting: Why DataPulse Stands Out
By removing the complexity from reporting and delivering data in an easy-to-understand format, DataPulse empowers businesses and agencies to make better decisions, faster.
We built DataPulse to solve the frustrations we were experiencing with trying to automate reporting across multiple platforms.
We needed something that would reduce complexity, save time, and deliver meaningful insights—not just data dumps.
If you’re tired of juggling multiple tools or frustrated by the limitations of existing platforms, I’d suggest that you give DataPulse a try. Whether you’re looking to improve your client reporting, streamline your agency’s workflow, or just gain a better understanding of your marketing performance, DataPulse can help you get there.
Is Your Reporting Solution the Best It Can Be?
Effective reporting is the cornerstone of any successful digital marketing strategy. By simplifying data collection and focusing on insights rather than just raw numbers, DataPulse can revolutionize the way agencies and businesses alike track and report on their marketing performance.
Ready to take control of your reporting? Try DataPulse today and see how it can transform the way you measure and optimize your marketing performance.


 .
.


no replies